Swimming through time with the FishTail - Part 2 (FishTail + GDB)
This is a follow up guide to Part 1 where we went through the process of building our wireless ARM debug probe: FishTail. In part 2, we take a look how to make use of the FishTail probe to debug ARM targets using the GNU Debug Bridge (GDB)
Definition of terms
Before getting our hands dirty, there are a few key terms we need to get out of the way:
- Host - the device on which the debugger is running
- Target - the device on which the program being debugged is running
- Debug probe/adapter - special hardware that allows you to control and monitor a program running on a target device.
- Debug translator - a program running on a host computer that coordinates the debugging of a program running on the target machine by running the target program under controlled conditions and allowing the programmer to monitor changes in computer resources. We use gdb.
Requirements
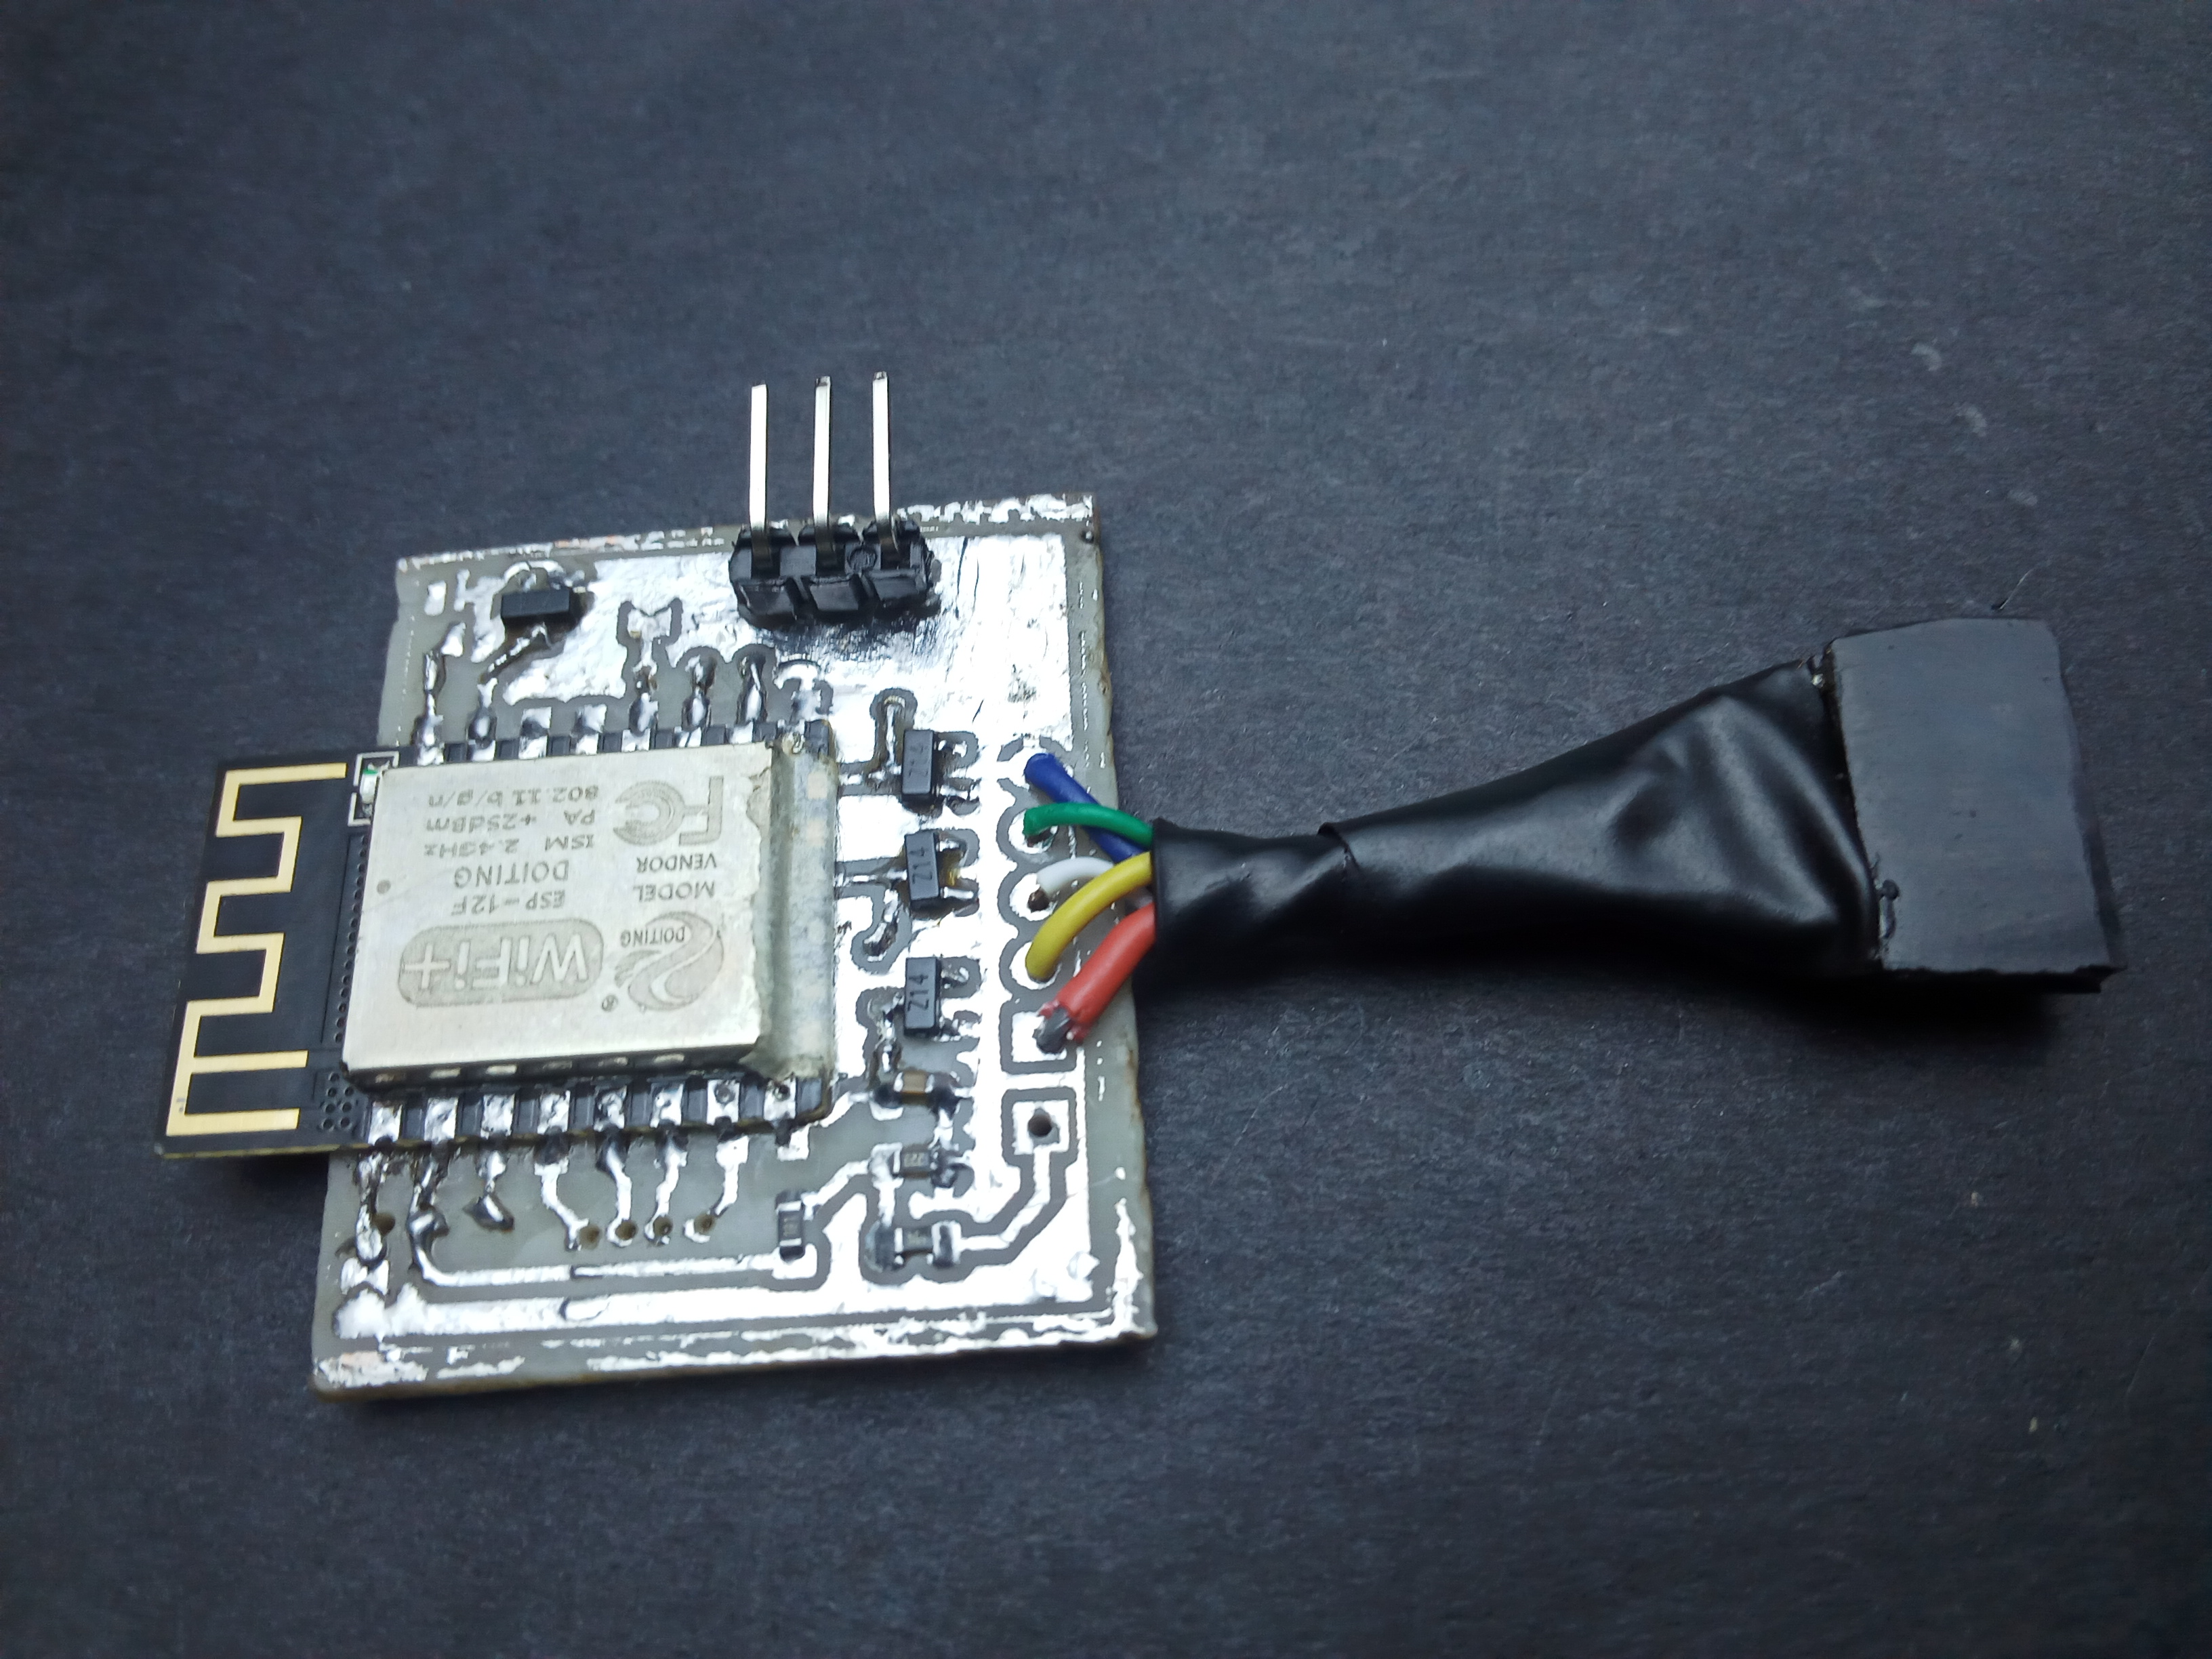
- The FishTail probe
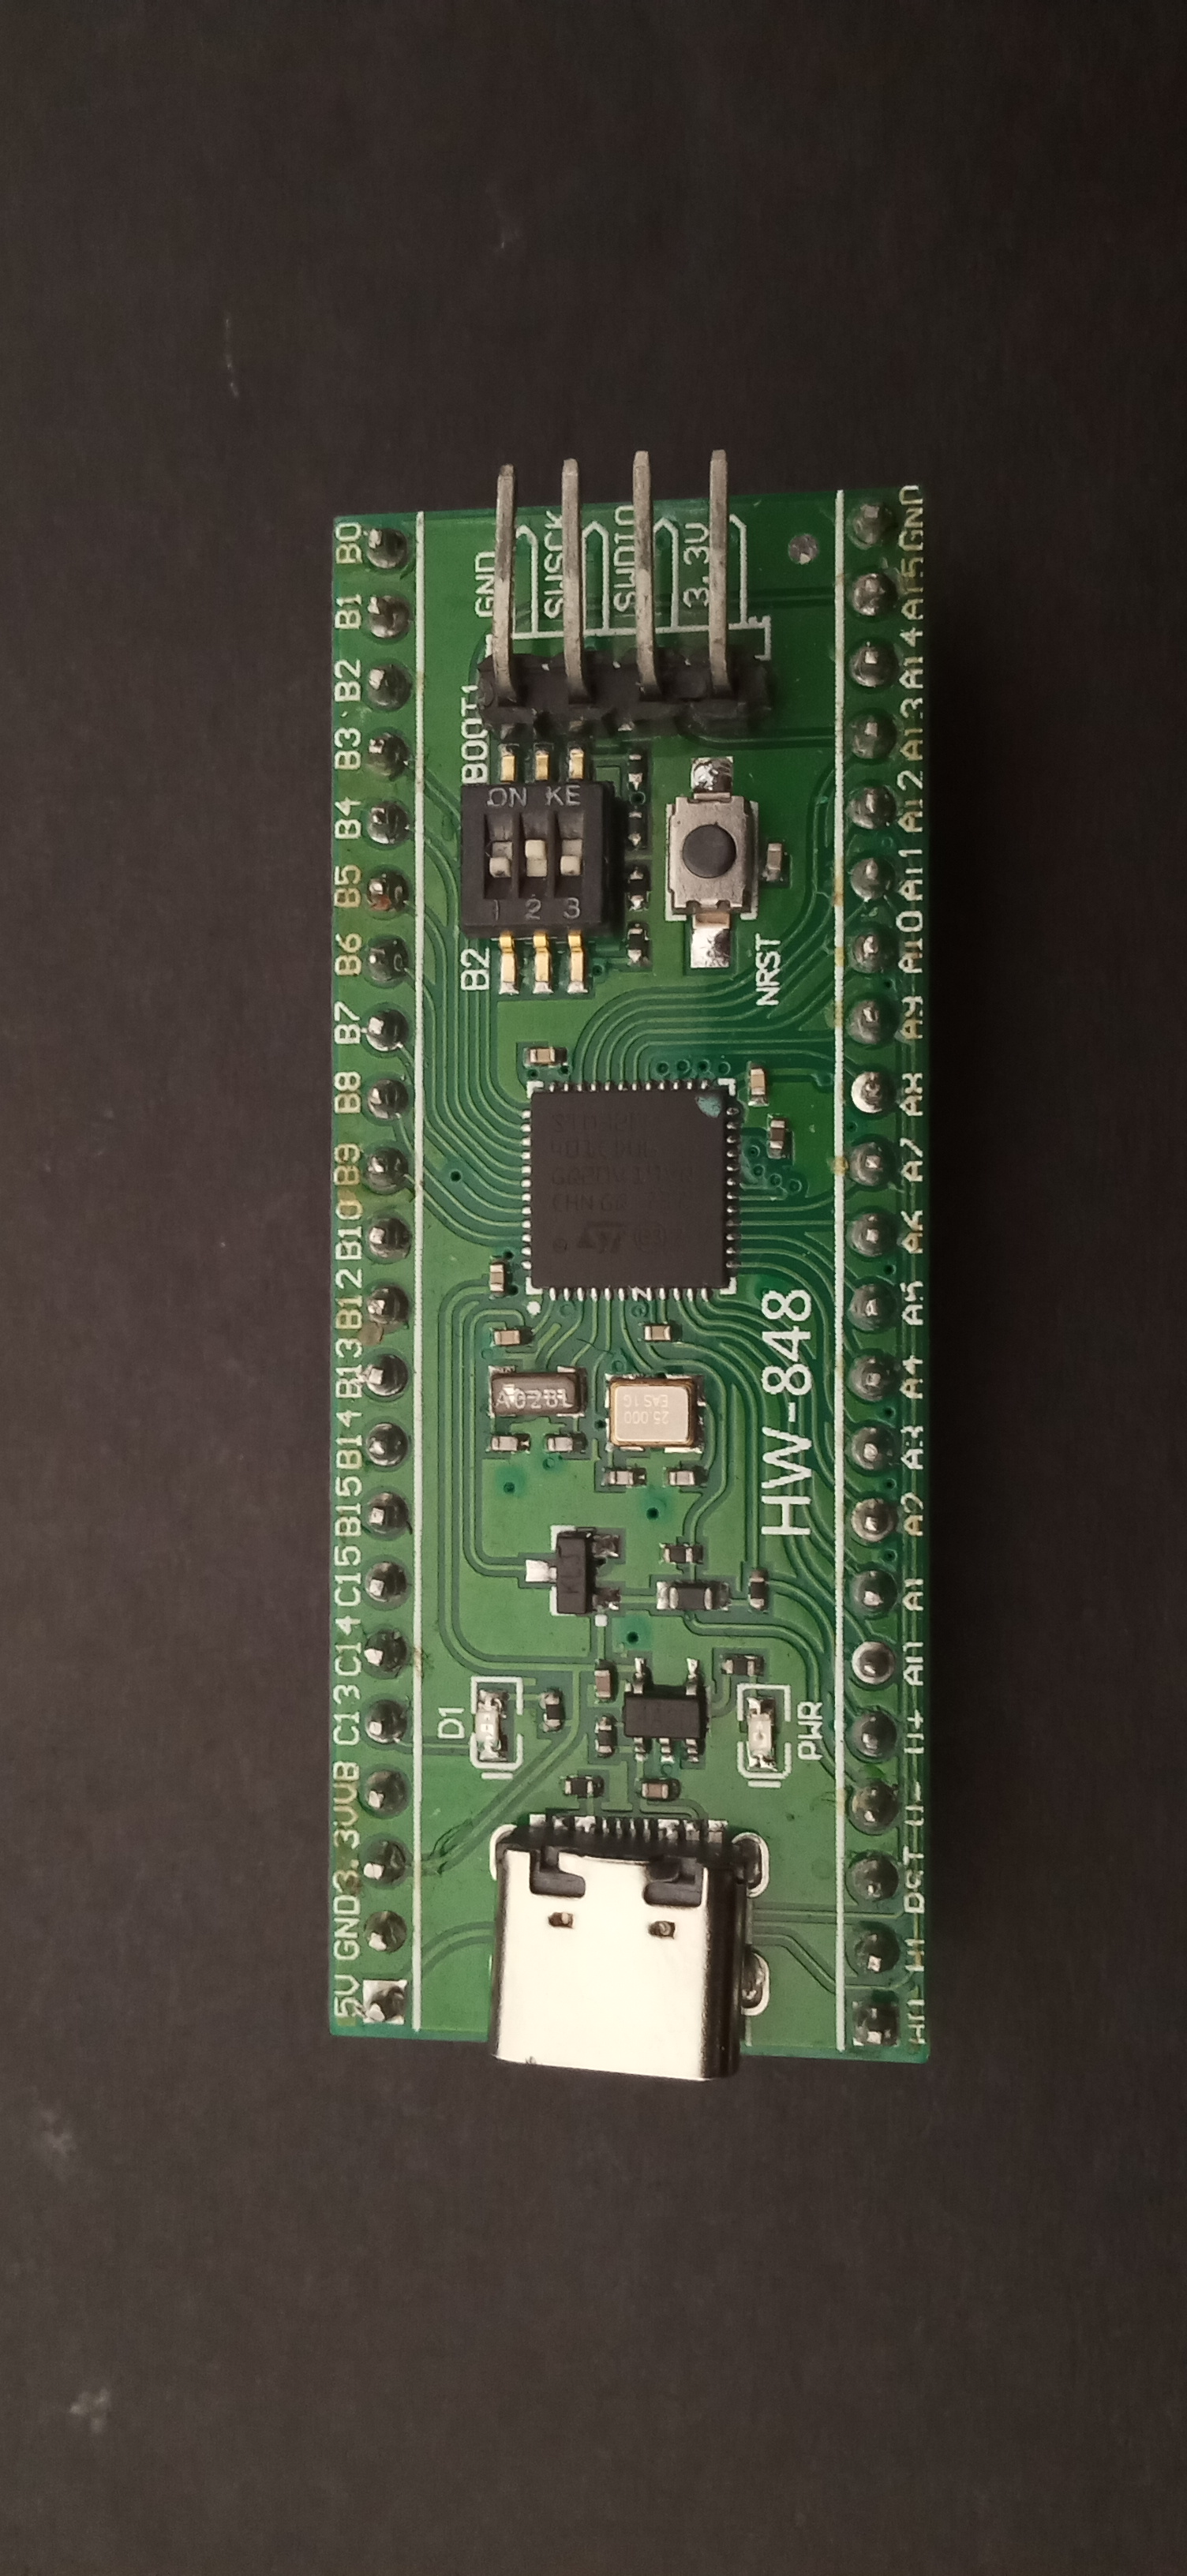
- An ARM target dev board - I am using an STM32F401 Mini
- Power supply
- You can use USB for this if your dev board features a USB port
Edit - 27/03/2022:
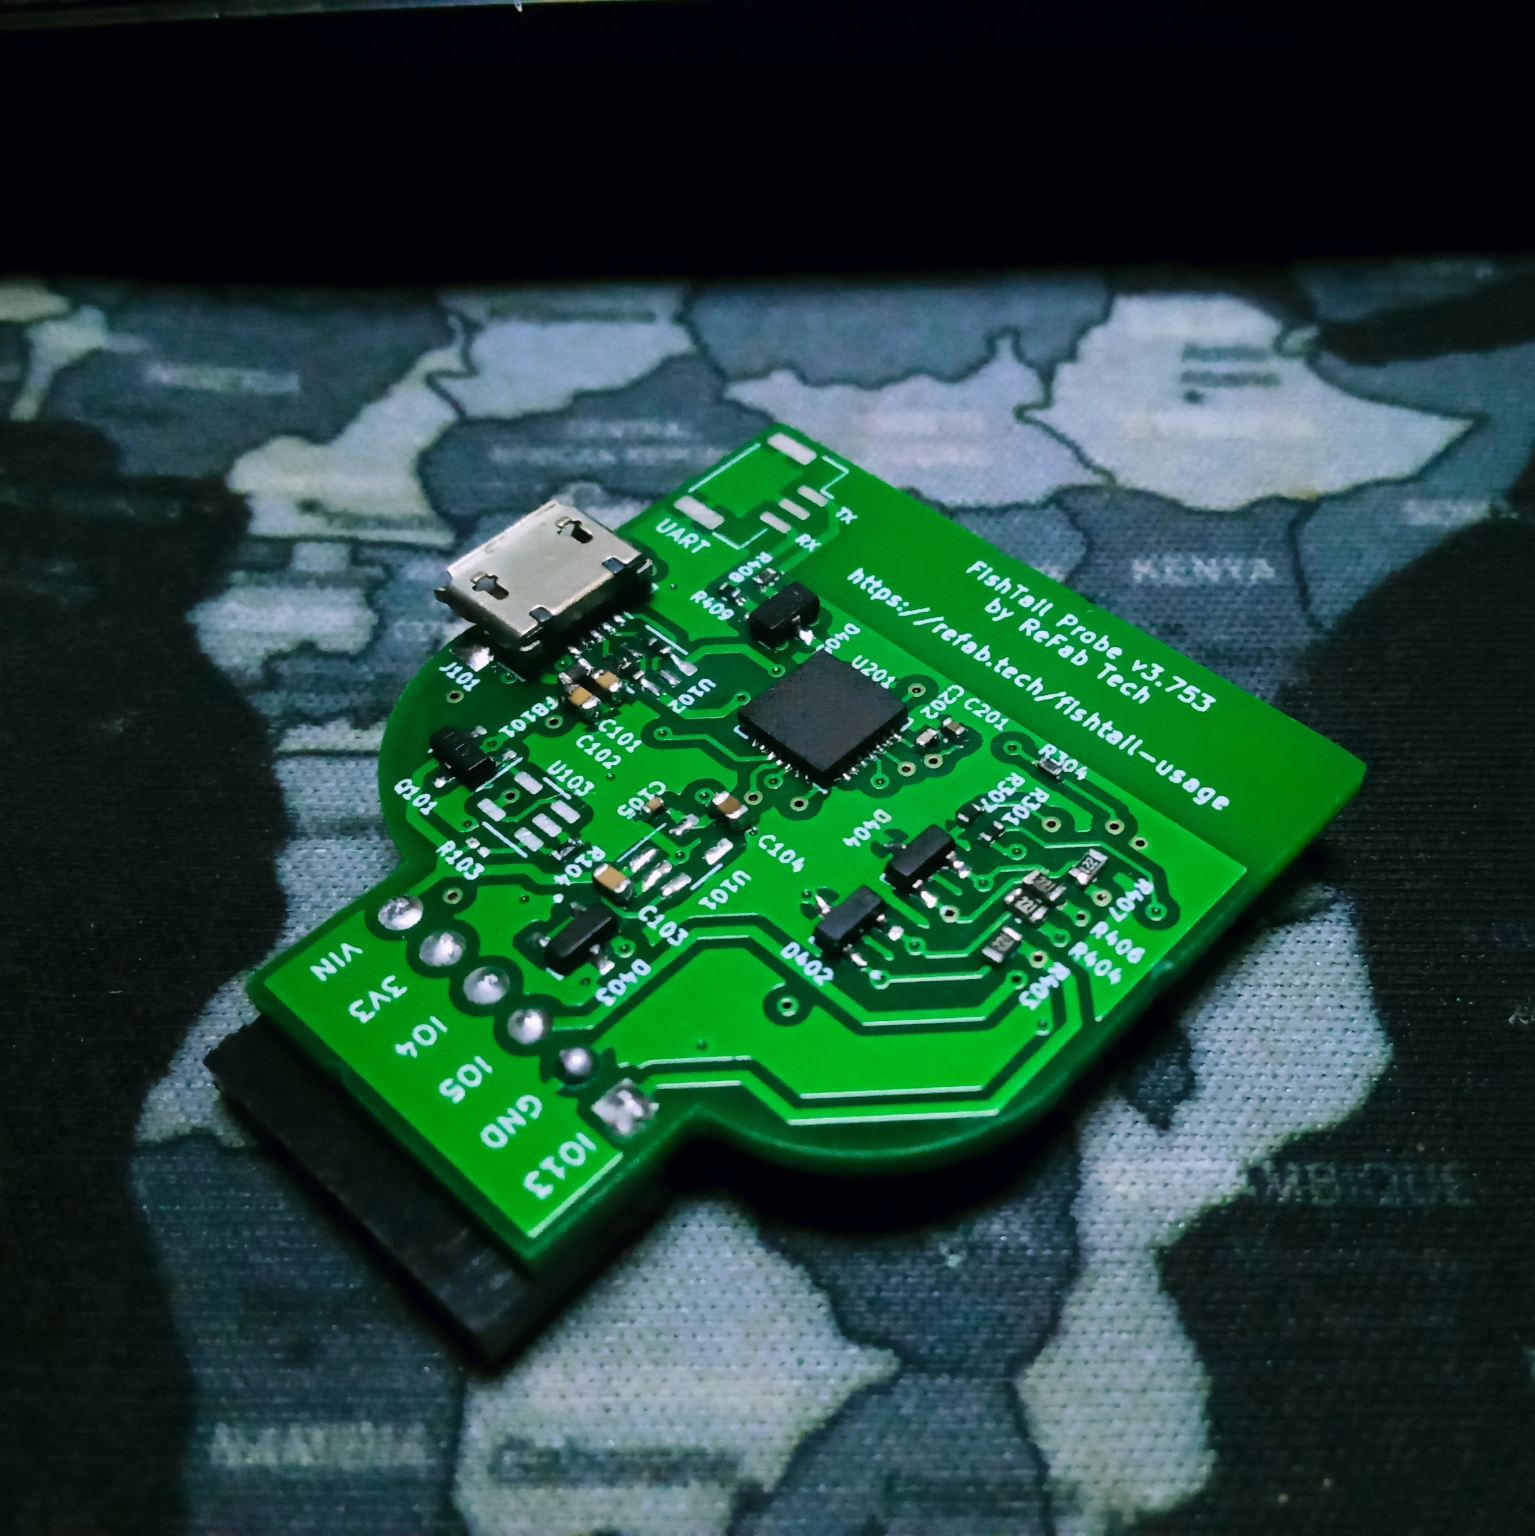
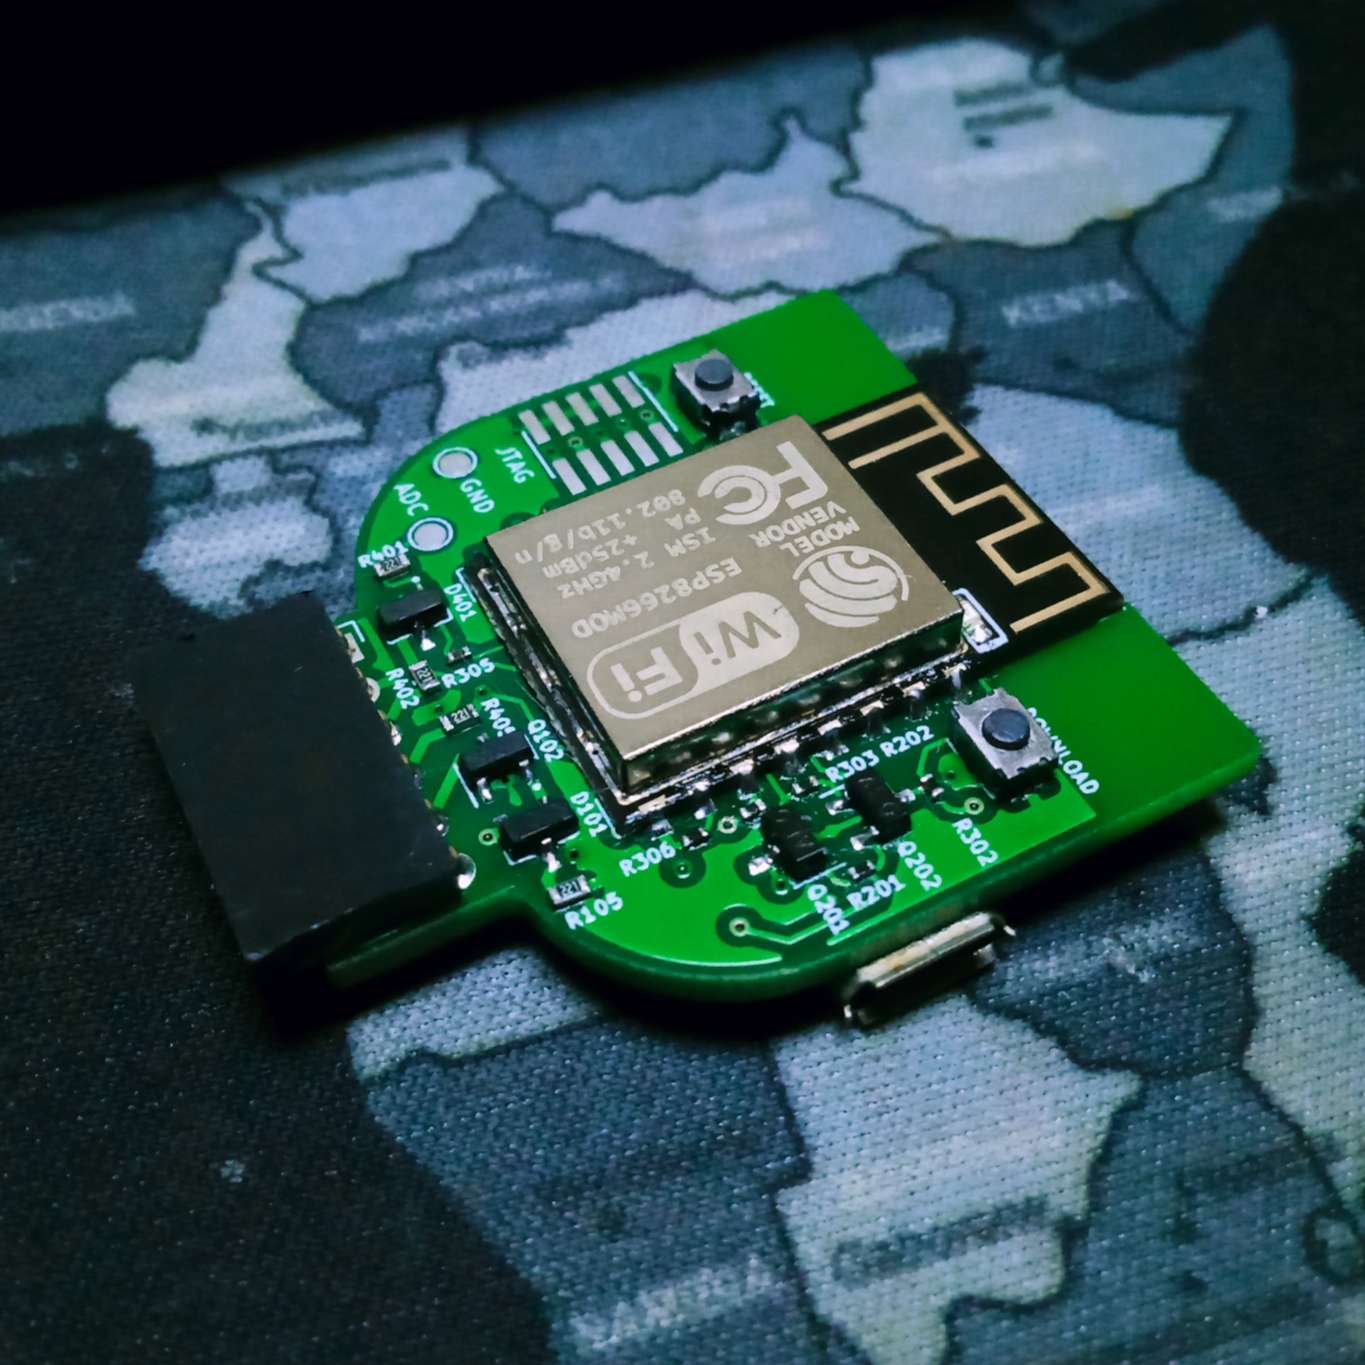
FishTail Probe v3_753 is out! Better Hardware, good old functionality.
Software
Installing the Debugger
Windows
- Download the official GNU ARM toolchain from the ARM developer website
The one I downloaded was named
arm-gnu-toolchain-11.3.rel1-mingw-w64-i686-arm-none-eabi.exefor my x86_64 system. - Run the installer and follow the wizard till the installation is complete.
Linux
- Run the following command to install the debugger using apt package manager.
sudo apt-get install gcc-arm-none-eabi gdb-multiarch -y
Hardware Connection
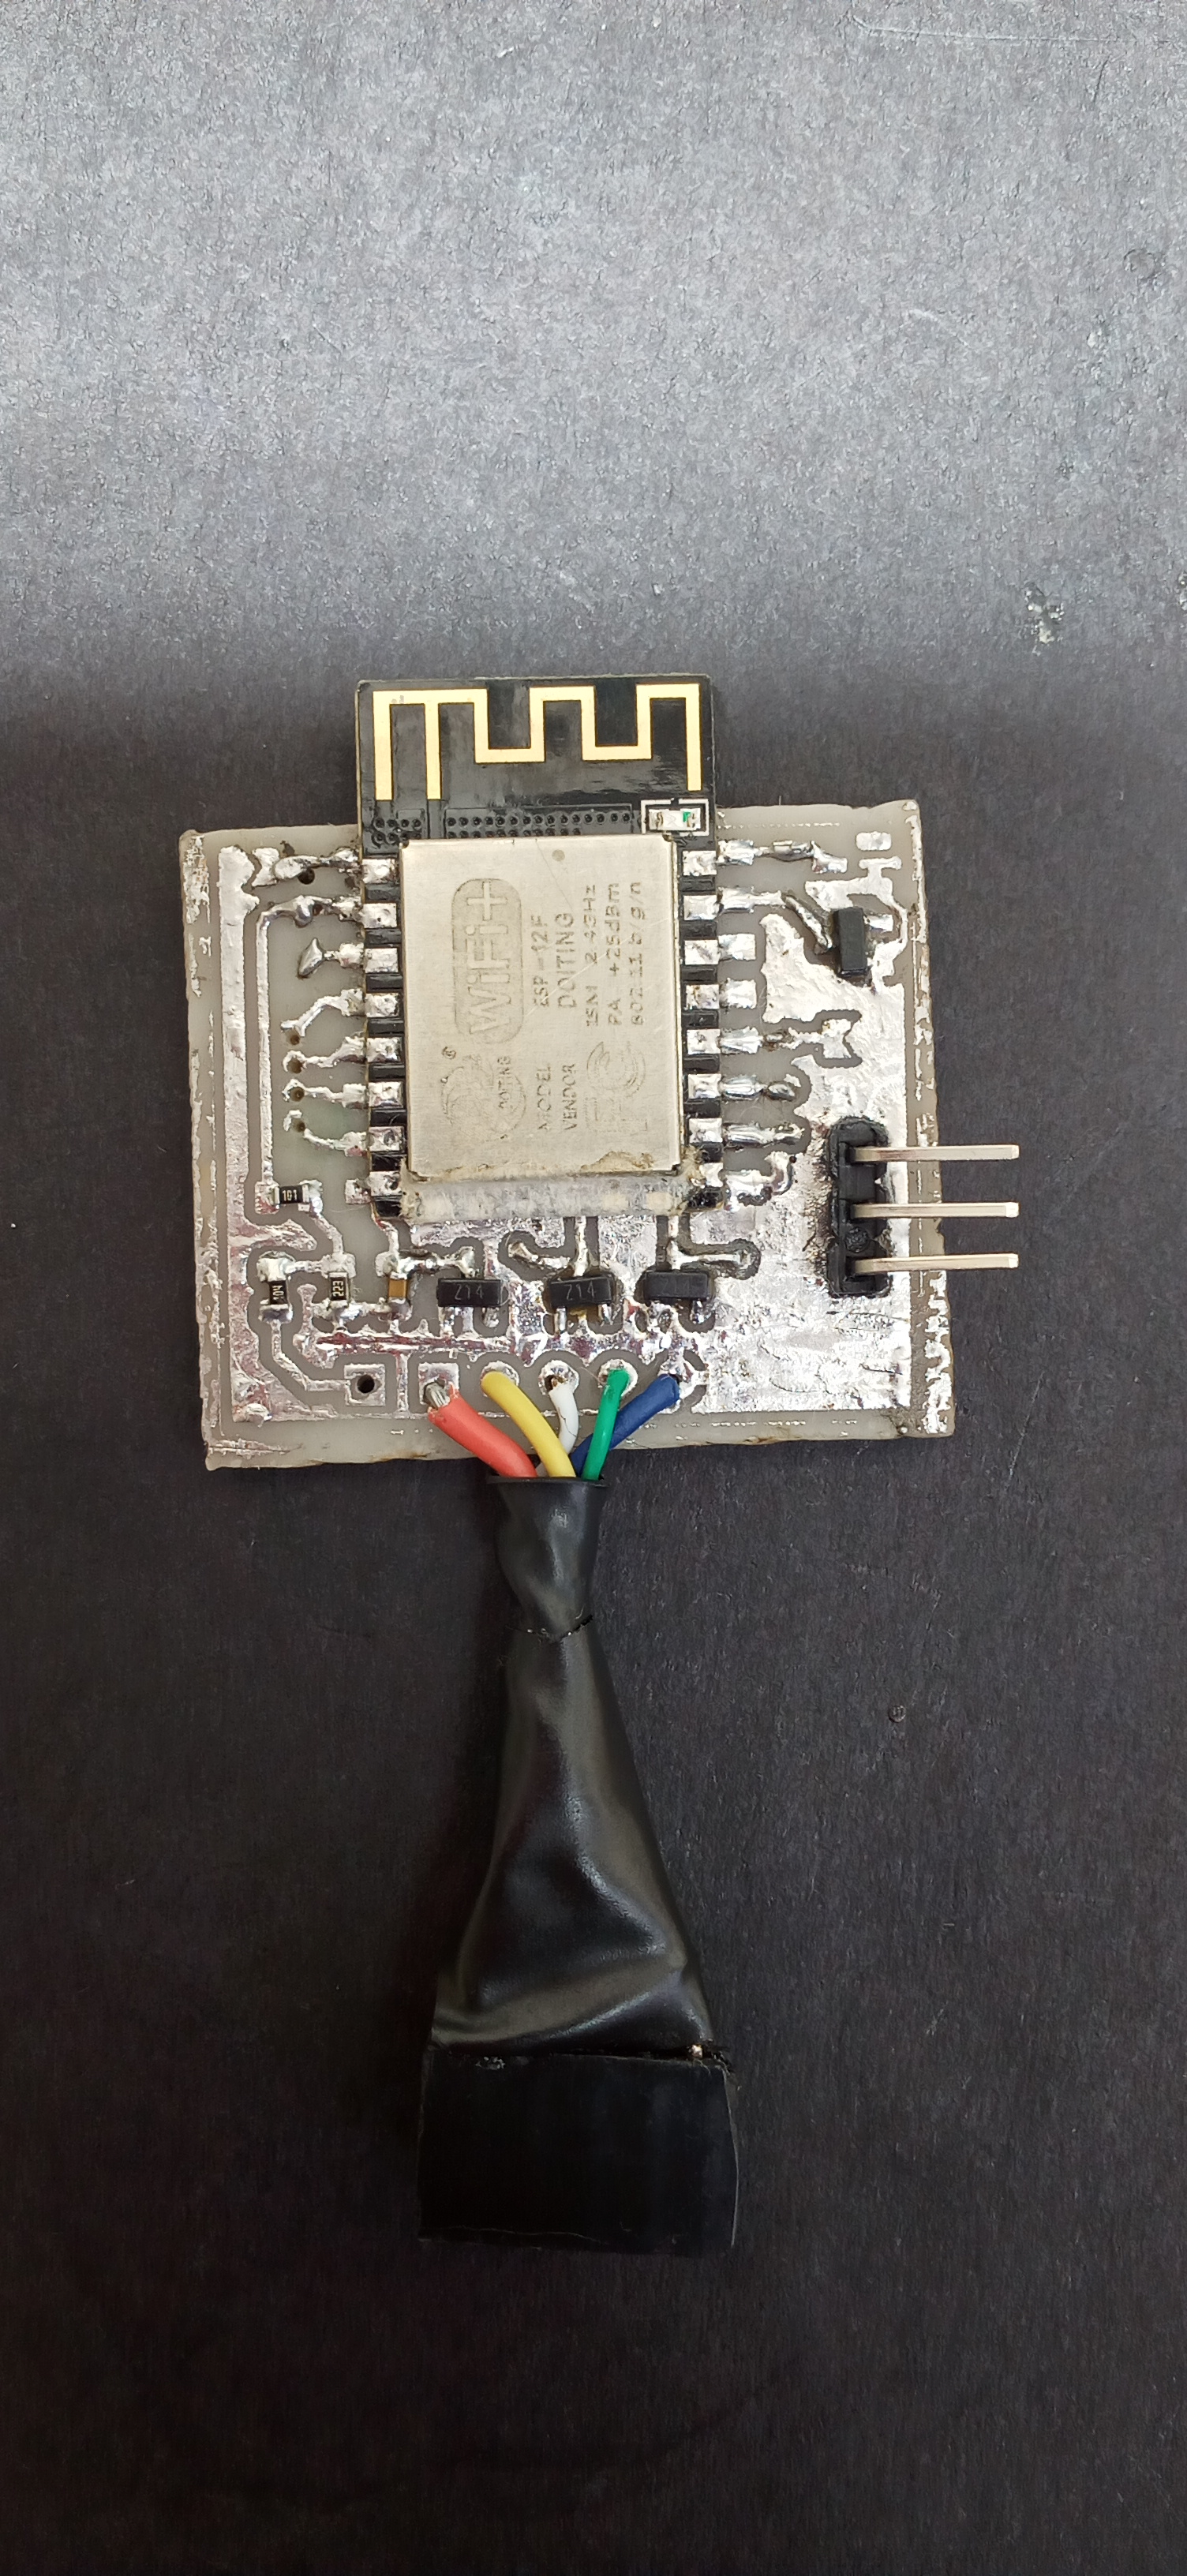
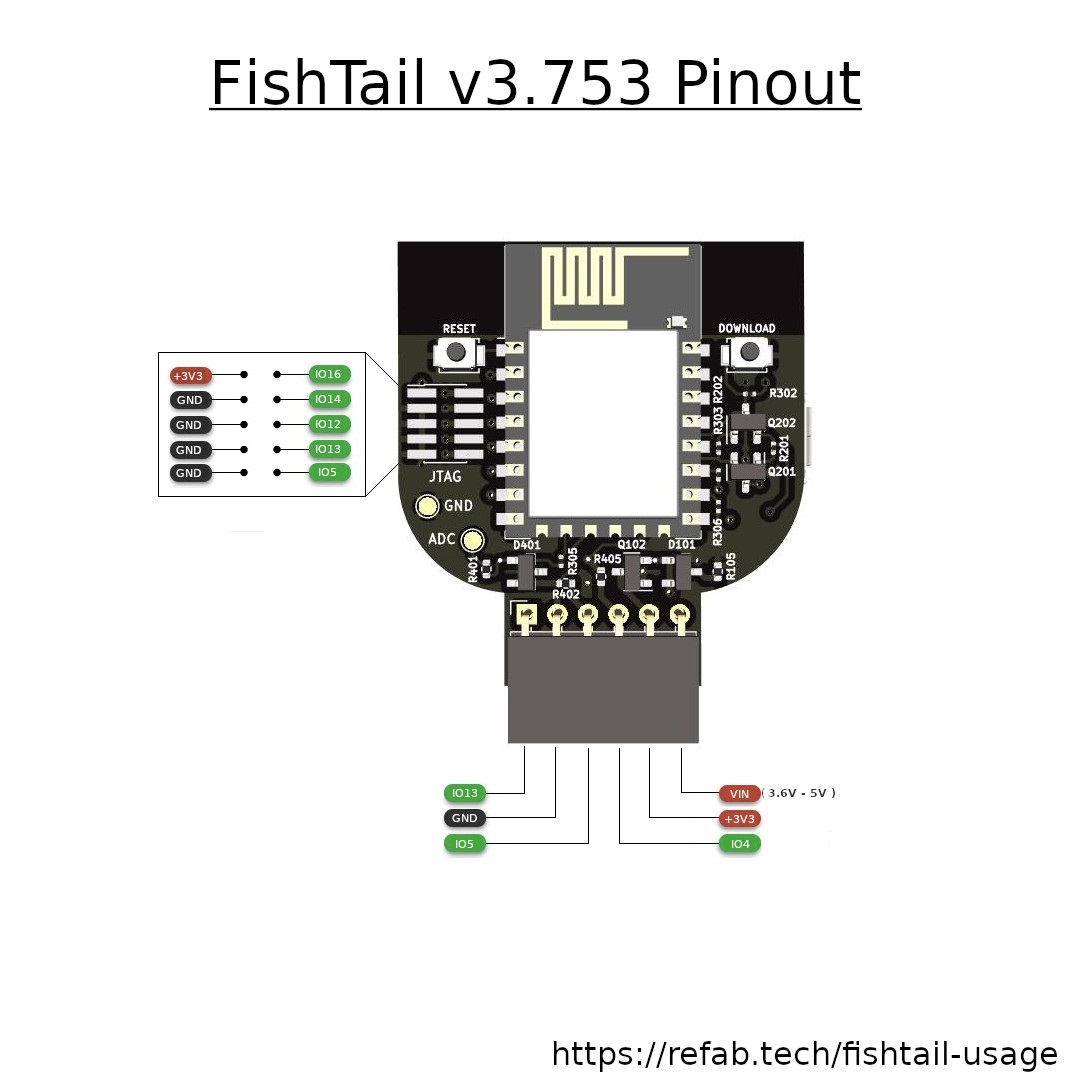
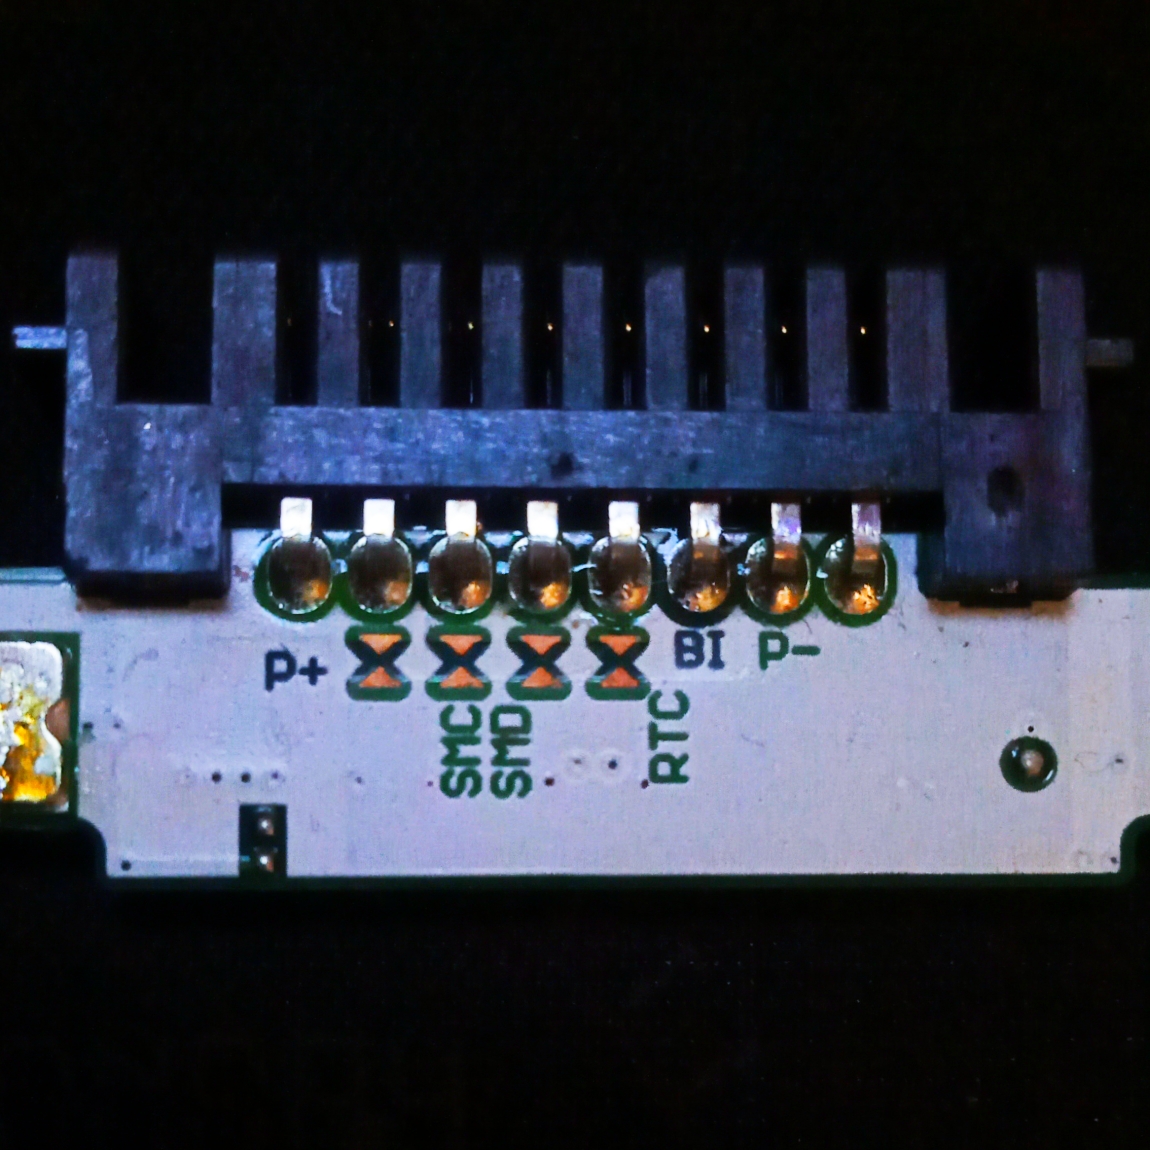
- The tail of the probe is designed for direct connection to the dev board debug header as shown below. The actual connection scheme you use will depend on the target debug pinout.
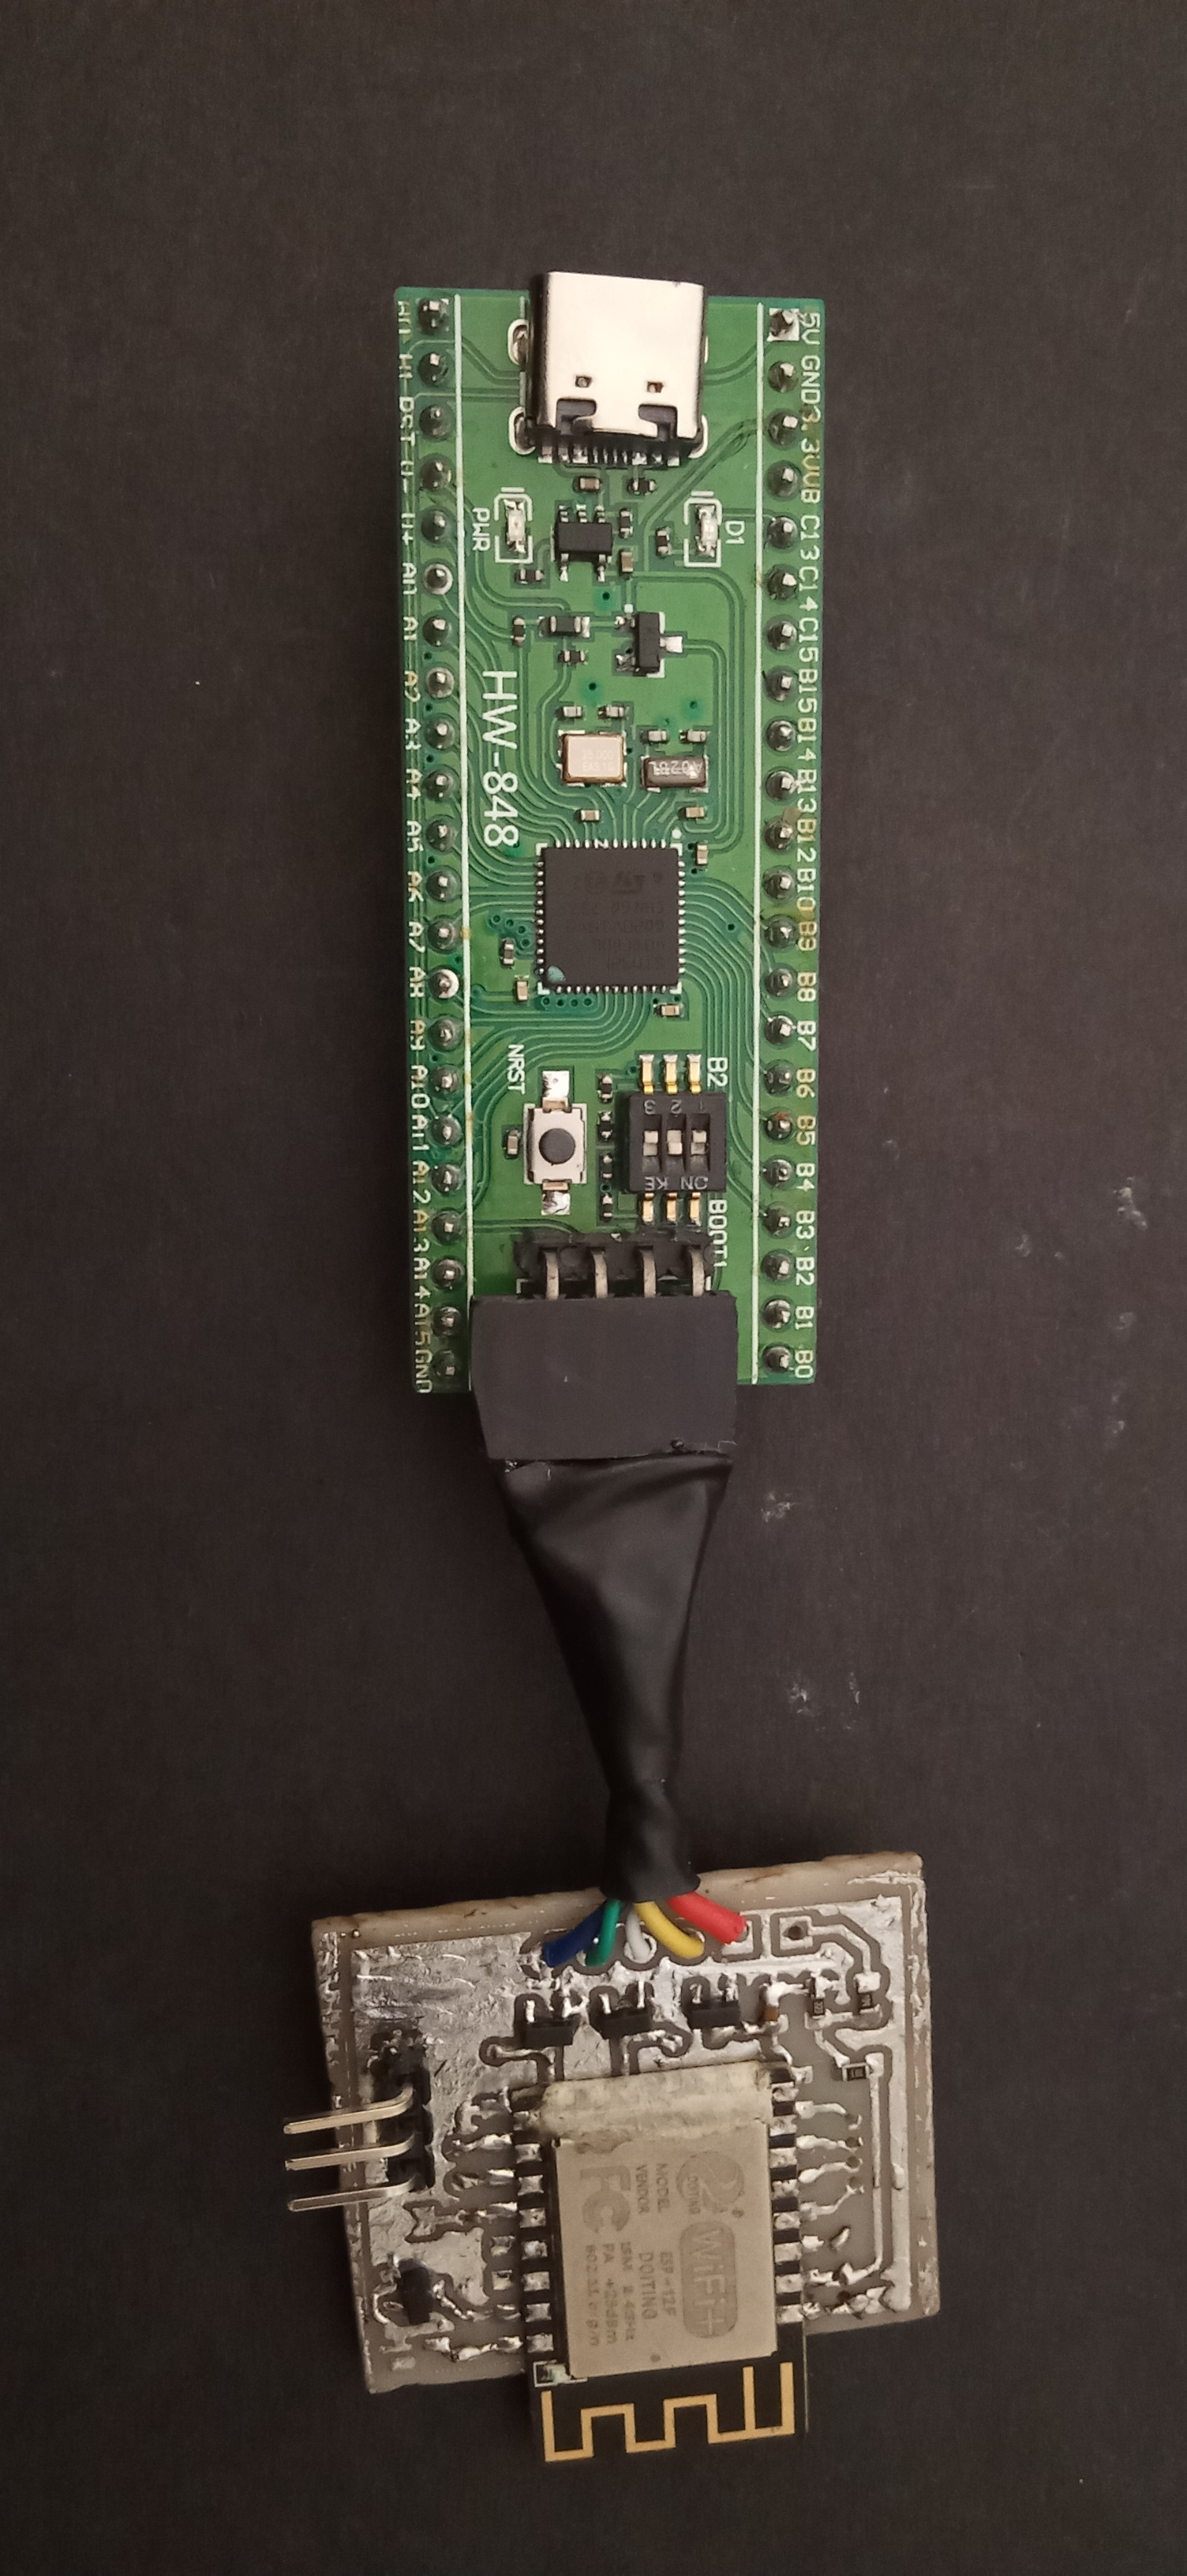
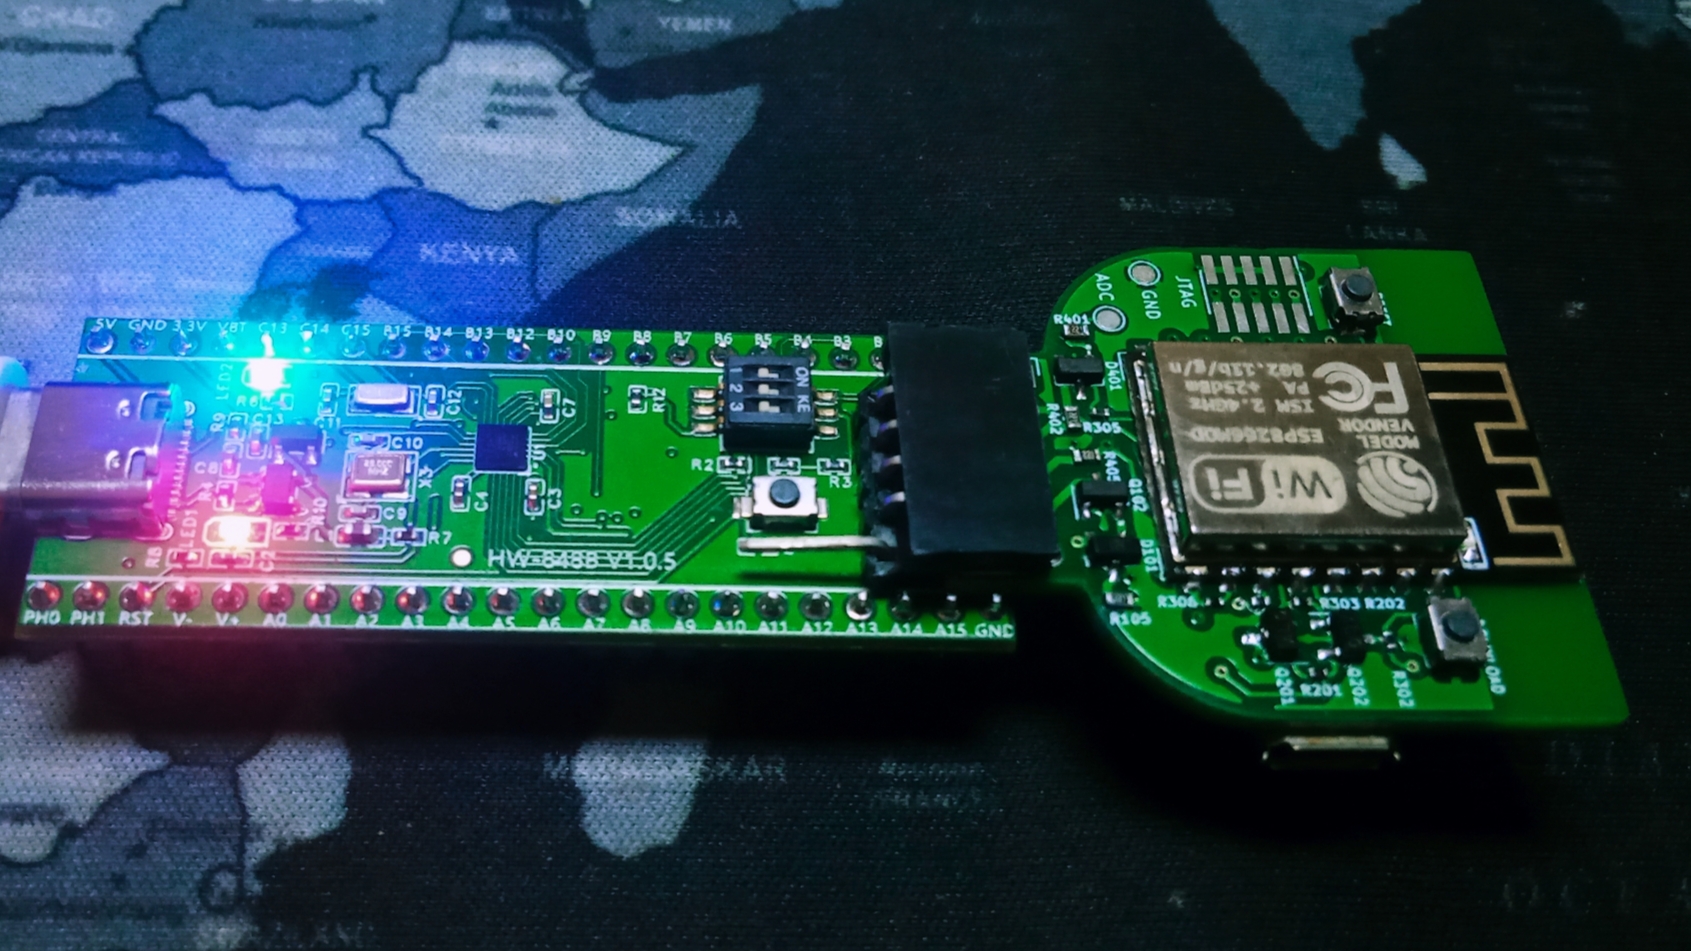
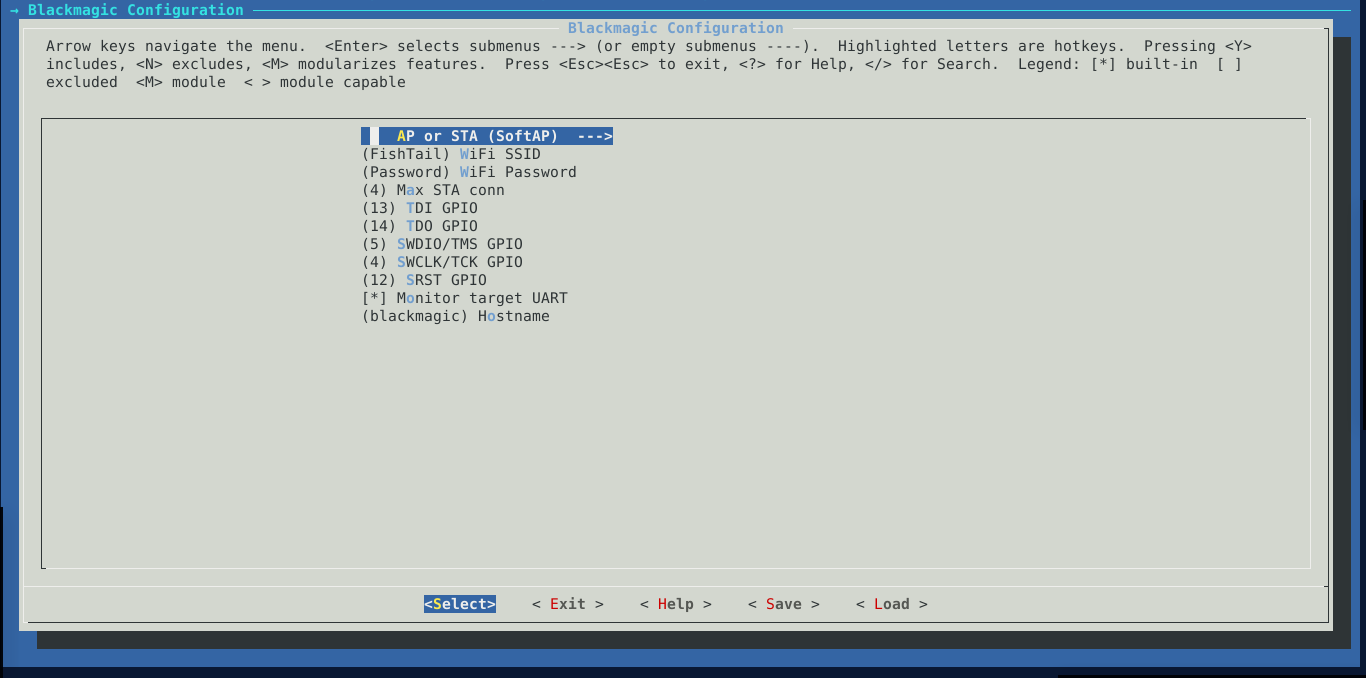
- Make sure your software configuration of the probe matches your hardware connection then power up the target, which should also power the probe. The software configuration I used is shown.
Flashing firmware to the target
- Open a terminal session in the directory containing the .elf file of your firmware and create a
flash.gdbfile with the following contents:
  set confirm off
  target remote 192.168.4.1:2022
  monitor reset
  load
  detach
  quit
- If you configured your FishTail in station mode (to connect to your local wi-fi network) you need to connect to the same wi-fi network as your probe, then figure out its assigned IP address. Then, replace
192.168.4.1with said IP. - If configured as an access point, connect to the wi-fi access point created by your probe.
So Far you should have the following file structure in your current working directory(MyProject):
MyProject
|- flash.gdb
|- myfirmware.elf
Enter the following command to upload code to your target: On Windows
arm-none-eabi-gdb --command=flash.gdb myfirmware.elf
On Linux
gdb-multiarch --command=flash.gdb myfirmware.elf
You should get output similar to the following
$ arm-none-eabi-gdb -command=flash.gdb myfirmware.elf
GNU gdb (Arm GNU Toolchain 11.3.Rel1) 12.1.90.20220802-git
Copyright (C) 2022 Free Software Foundation, Inc.
License GPLv3+: GNU GPL version 3 or later <http://gnu.org/licenses/gpl.html>
This is free software: you are free to change and redistribute it.
There is NO WARRANTY, to the extent permitted by law.
Type "show copying" and "show warranty" for details.
This GDB was configured as "--host=i686-w64-mingw32 --target=arm-none-eabi".
Type "show configuration" for configuration details.
For bug reporting instructions, please see:
<https://bugs.linaro.org/>.
Find the GDB manual and other documentation resources online at:
    <http://www.gnu.org/software/gdb/documentation/>.

For help, type "help".
Type "apropos word" to search for commands related to "word"...
Reading symbols from myfirmware.elf...
0xfffffffe in ?? ()
Loading section .isr_vector, size 0x194 lma 0x8000000
Loading section .text, size 0xf74 lma 0x8000194
Loading section .rodata, size 0x10 lma 0x8001108
Loading section .ARM, size 0x8 lma 0x8001118
Loading section .init_array, size 0x4 lma 0x8001120
Loading section .fini_array, size 0x4 lma 0x8001124
Loading section .data, size 0xc lma 0x8001128
Start address 0x08000d7c, load size 4404
Transfer rate: 1 KB/sec, 400 bytes/write.
[Inferior 1 (Remote target) detached]
It seems like a lot of information but let us look through it line by line. First, GDB prints its license information along with its version number.
GNU gdb (Arm GNU Toolchain 11.3.Rel1) 12.1.90.20220802-git
Copyright (C) 2022 Free Software Foundation, Inc.
License GPLv3+: GNU GPL version 3 or later <http://gnu.org/licenses/gpl.html>
This is free software: you are free to change and redistribute it.
There is NO WARRANTY, to the extent permitted by law.
Type "show copying" and "show warranty" for details.
Then we have the target and host configuration. GDB knows the host system it is running on but the target specification is done automatically when gdb reads the .elf file.
This GDB was configured as "--host=i686-w64-mingw32 --target=arm-none-eabi".
Type "show configuration" for configuration details.
Helpful:
We are using the arm-none-eabi version of gdb: arm-none-eabi-gdb so only one target architecture is supported. However, gdb-multiarch supports multiple target architectures which can either be determined from the .elf file or overridden manually after running gdb using the set architecture command.
To view the current target and host configuration as well as other information, enter the gdb command show configuration
Next we have usage information
For bug reporting instructions, please see:
<https://bugs.linaro.org/>.
Find the GDB manual and other documentation resources online at:
    <http://www.gnu.org/software/gdb/documentation/>.

For help, type "help".
Type "apropos word" to search for commands related to "word"...
Then the actual process of loading firmware onto the target:
Reading symbols from myfirmware.elf...
0xfffffffe in ?? ()
Loading section .isr_vector, size 0x194 lma 0x8000000
Loading section .text, size 0xf74 lma 0x8000194
Loading section .rodata, size 0x10 lma 0x8001108
Loading section .ARM, size 0x8 lma 0x8001118
Loading section .init_array, size 0x4 lma 0x8001120
Loading section .fini_array, size 0x4 lma 0x8001124
Loading section .data, size 0xc lma 0x8001128
Start address 0x08000d7c, load size 4404
Transfer rate: 1 KB/sec, 400 bytes/write.
[Inferior 1 (Remote target) detached]
For more information about the memory sections in your .elf file, run maintenance info sections
(gdb) maintenance info sections
Exec file: `\path\to\firmware\myfirmware.elf', file type elf32-littlearm.
 [0]      0x8000000->0x8000194 at 0x00010000: .isr_vector ALLOC LOAD READONLY DATA HAS_CONTENTS
 [1]      0x8000194->0x8001108 at 0x00010194: .text ALLOC LOAD READONLY CODE HAS_CONTENTS
 [2]      0x8001108->0x8001118 at 0x00011108: .rodata ALLOC LOAD READONLY DATA HAS_CONTENTS
 [3]      0x8001118->0x8001120 at 0x00011118: .ARM ALLOC LOAD READONLY DATA HAS_CONTENTS
 [4]      0x8001120->0x8001124 at 0x00011120: .init_array ALLOC LOAD DATA HAS_CONTENTS
 [5]      0x8001124->0x8001128 at 0x00011124: .fini_array ALLOC LOAD DATA HAS_CONTENTS
 [6]      0x20000000->0x2000000c at 0x00020000: .data ALLOC LOAD DATA HAS_CONTENTS
 [7]      0x2000000c->0x2000002c at 0x0002000c: .bss ALLOC
 [8]      0x2000002c->0x20000630 at 0x0002002c: ._user_heap_stack ALLOC
 [9]      0x0000->0x0030 at 0x0002000c: .ARM.attributes READONLY HAS_CONTENTS
 [10]     0x0000->0x0033 at 0x0002003c: .comment READONLY HAS_CONTENTS
 [11]     0x0000->0x4cac at 0x0002006f: .debug_info READONLY HAS_CONTENTS
 [12]     0x0000->0x128e at 0x00024d1b: .debug_abbrev READONLY HAS_CONTENTS
 [13]     0x0000->0x1913 at 0x00025fa9: .debug_loc READONLY HAS_CONTENTS
 [14]     0x0000->0x0420 at 0x000278c0: .debug_aranges READONLY HAS_CONTENTS
 [15]     0x0000->0x0370 at 0x00027ce0: .debug_ranges READONLY HAS_CONTENTS
 [16]     0x0000->0x31e2 at 0x00028050: .debug_line READONLY HAS_CONTENTS
 [17]     0x0000->0x1db3 at 0x0002b232: .debug_str READONLY HAS_CONTENTS
 [18]     0x0000->0x079c at 0x0002cfe8: .debug_frame READONLY HAS_CONTENTS
 [19]     0x0000->0x0b9a at 0x0002d784: .debug_loclists READONLY HAS_CONTENTS
 [20]     0x0000->0x00b8 at 0x0002e31e: .debug_rnglists READONLY HAS_CONTENTS
 [21]     0x0000->0x00d5 at 0x0002e3d6: .debug_line_str READONLY HAS_CONTENTS
(gdb)
Timewalking
The most important usage of gdb is in controlling and monitoring the target program and the effect it has on the target computer resources. I call it timewalking as you can, relatively, stop the progression time for the target while you are at it and resume it to step through the code line by line at your leisure. With your computer still connected to the FishTail via wi-fi, run gdb with your firmware as an input file.
$ arm-none-eabi-gdb myfirmware.elf
Specifying the target
Tell gdb to connect to the target
target extended-remote 192.168.4.1:2022
replace 192.168.4.1 with your FishTail IP address if in station mode.
Loading firmware
Load the firmware with load
(gdb) load Loading section .isr_vector, size 0x194 lma 0x8000000 Loading section .text, size 0xf74 lma 0x8000194 Loading section .rodata, size 0x10 lma 0x8001108 Loading section .ARM, size 0x8 lma 0x8001118 Loading section .init_array, size 0x4 lma 0x8001120 Loading section .fini_array, size 0x4 lma 0x8001124 Loading section .data, size 0xc lma 0x8001128 Start address 0x08000d7c, load size 4404 Transfer rate: 1 KB/sec, 400 bytes/write.
Breakpoints
then set a breakpoint at main.
(gdb) break main
Breakpoint 1 at 0x8000382: file Core/Src/main.c, line 72.
This tells gdb to that when it runs the target program, it should stop at the main function and await further instruction.
Type continue and the program should stop when it hits the breakpoint
(gdb) c
Continuing.

Breakpoint 1, main () at Core/Src/main.c:72
72        HAL_Init();
Use info break to view existing breakpoints and delete break <num> (where num is the breakpoint number) to delete a breakpoint.
(gdb) info br
Num     Type           Disp Enb Address    What
1       breakpoint     keep y   0x08000382 in main at Core/Src/main.c:72
(gdb) del 1
(gdb) info br
No breakpoints or watchpoints.
Helpful
A keen eye will notice that instead of typing out the entire command, it is also valid to use the first few letters and gdb will interpret the command just fine. You can use just the first letter, but that would be ambiguous as there may be multiple commands that start the same way. Nonetheless, I believe gdb evaluates them in alphabetical order so the first command alphabetically would take the cake here.
To move to execute the current line and stop at the next line type next, use next. You can keep hitting enter and the last entered command (next) will be run again each time.
(gdb) n
79        SystemClock_Config();
(gdb) n
86        MX_GPIO_Init();
(gdb)
99          HAL_GPIO_TogglePin(GPIOC, GPIO_PIN_13);
(gdb)
100         HAL_Delay(500);
Source preview
In my firmware there are only two lines of code in the main loop so pressing enter again just loops over the two lines. The list command gives a sneak preview of the lines of code before and after the current one
(gdb) n
99          HAL_GPIO_TogglePin(GPIOC, GPIO_PIN_13);
(gdb)
100         HAL_Delay(500);
(gdb)
93        while (1)
(gdb)
99          HAL_GPIO_TogglePin(GPIOC, GPIO_PIN_13);
(gdb)
100         HAL_Delay(500);
(gdb)
93        while (1)
(gdb)
99          HAL_GPIO_TogglePin(GPIOC, GPIO_PIN_13);
(gdb)
100         HAL_Delay(500);
(gdb) list
95          /* USER CODE END WHILE */
96
97
98          /* USER CODE BEGIN 3 */
99          HAL_GPIO_TogglePin(GPIOC, GPIO_PIN_13);
100         HAL_Delay(500);
101       }
102       /* USER CODE END 3 */
103     }
104
(gdb)
Stepping into functions
When you need to debug a function, it is necessary to first enter the context of the function before you can monitor the state of local variables or run the lines of code in the function line by line. We use step for this purpose.
93        while (1)
(gdb) n
99          HAL_GPIO_TogglePin(GPIOC, GPIO_PIN_13);
(gdb) s
HAL_GPIO_TogglePin (GPIOx=GPIOx@entry=0x40020800, GPIO_Pin=GPIO_Pin@entry=8192) at Drivers/STM32F4xx_HAL_Driver/Src/stm32f4xx_hal_gpio.c:441
441       odr = GPIOx->ODR;
(gdb) list
436
437       /* Check the parameters */
438       assert_param(IS_GPIO_PIN(GPIO_Pin));
439
440       /* get current Output Data Register value */
441       odr = GPIOx->ODR;
442
443       /* Set selected pins that were at low level, and reset ones that were high */
444       GPIOx->BSRR = ((odr & GPIO_Pin) << GPIO_NUMBER) | (~odr & GPIO_Pin);
445     }
(gdb)
You can then continue debugging as before using next to step through the code line by line. To exit the context of the function, use finish and the code runs until it the function completes and returns.
(gdb) finish
Run till exit from #0  HAL_GPIO_TogglePin (GPIOx=GPIOx@entry=0x40020800, GPIO_Pin=GPIO_Pin@entry=8192) at Drivers/STM32F4xx_HAL_Driver/Src/stm32f4xx_hal_gpio.c:441
main () at Core/Src/main.c:100
100         HAL_Delay(500);
Register information
To inspect the effect that each line of code has on the target device resources, we can inspect register contents using info registers which gives a summary
(gdb) info registers
r0             0x40020800          1073874944
r1             0x2000              8192
r2             0x0                 0
r3             0x0                 0
r4             0x2000002c          536870956
r5             0x0                 0
r6             0x0                 0
r7             0x0                 0
r8             0x0                 0
r9             0x0                 0
r10            0x0                 0
r11            0x0                 0
r12            0x0                 0
sp             0x20017ff8          0x20017ff8
lr             0x8000399           0x8000399 <main+24>
pc             0x8000398           0x8000398 <main+24>
xpsr           0x61000000          1627389952
fpscr          0x0                 0
msp            0x20017ff8          0x20017ff8
psp            0x0                 0x0
primask        0x0                 0 '\000'
basepri        0x0                 0 '\000'
faultmask      0x0                 0 '\000'
control        0x0                 0 '\000'
and info all-registers to see the state of all Cortex regiters
Watchpoints
Suppose you would like to monitor the value of a variable to figure out whether it your algorithm is working right. We use a watchpoint which tells the debugger to monitor the value at a specific location in memory and stop and report as soon as the value changes. To set a watchpoint we use watch
(gdb) load
Loading section .isr_vector, size 0x194 lma 0x8000000
Loading section .text, size 0xf68 lma 0x8000194
Loading section .rodata, size 0x10 lma 0x80010fc
Loading section .ARM, size 0x8 lma 0x800110c
Loading section .init_array, size 0x4 lma 0x8001114
Loading section .fini_array, size 0x4 lma 0x8001118
Loading section .data, size 0xc lma 0x800111c
Start address 0x08000d70, load size 4392
Transfer rate: 2 KB/sec, 399 bytes/write.
(gdb) r
The program being debugged has been started already.
Start it from the beginning? (y or n) n
Program not restarted.
(gdb) b main
Breakpoint 1 at 0x8000380: file Core/Src/main.c, line 64.
Note: automatically using hardware breakpoints for read-only addresses.
(gdb) r
The program being debugged has been started already.
Start it from the beginning? (y or n) y
Starting program: \path\to\elf\myfirmware.elf
[Switching to Thread 1]

Breakpoint 1, main () at Core/Src/main.c:64
64      {
(gdb) n
72        HAL_Init();
(gdb)
79        SystemClock_Config();
(gdb)
86        MX_GPIO_Init();
(gdb)
93        int x = 1;
(gdb) n
100         x ^= 1;
(gdb) watch x
Watchpoint 2: x
(gdb) n
Watchpoint 2: x
Old value = 1
New value = 0
main () at Core/Src/main.c:101
101         HAL_GPIO_WritePin(GPIOC, GPIO_PIN_13,x);
(gdb)
Here, after loading the new firmware and setting a breakpoint at main, we use run to run the target program from the beginning and step through it line by line using next then we set a watchpoint for the variable x .
When we execute the next line (line 100) the value of x changes and gdb reports the change as well as the old and new values of the variable
(gdb) n
100         x ^= 1;
(gdb) watch x
Watchpoint 2: x
(gdb) n
Watchpoint 2: x
Old value = 1
New value = 0
main () at Core/Src/main.c:101
101         HAL_GPIO_WritePin(GPIOC, GPIO_PIN_13,x);
(gdb)
TUI
GDB offers a text user interface (TUI) that presents all the above information very conveniently. It is not available on the official Windows version of arm-none-eabi-gdb but is available in the xpack-dev-tools version for on Linux.
As usual, start by setting the target, loading firmware, setting a breakpoint and running the code from the beginning. Then launch the TUI with tui enable.
(gdb) target extended-remote 192.168.4.1:2022
Remote debugging using 192.168.4.1:2022
0x08000d4e in HAL_Delay (Delay=Delay@entry=500) at Drivers/STM32F4xx_HAL_Driver/Src/stm32f4xx_hal.c:400
400   while((HAL_GetTick() - tickstart) < wait)
(gdb) load
Loading section .isr_vector, size 0x194 lma 0x8000000
Loading section .text, size 0xf68 lma 0x8000194
Loading section .rodata, size 0x10 lma 0x80010fc
Loading section .ARM, size 0x8 lma 0x800110c
Loading section .init_array, size 0x4 lma 0x8001114
Loading section .fini_array, size 0x4 lma 0x8001118
Loading section .data, size 0xc lma 0x800111c
Start address 0x08000d70, load size 4392
Transfer rate: 3 KB/sec, 399 bytes/write.
(gdb) b main
Breakpoint 1 at 0x8000380: file Core/Src/main.c, line 64.
Note: automatically using hardware breakpoints for read-only addresses.
(gdb) r
The program being debugged has been started already.
Start it from the beginning? (y or n) y
Starting program: /path/to/elf/myfirmware.elf
[Switching to Thread 1]

Breakpoint 1, main () at Core/Src/main.c:64
64  {
(gdb) tui enable
You will be presented with an interface as below:
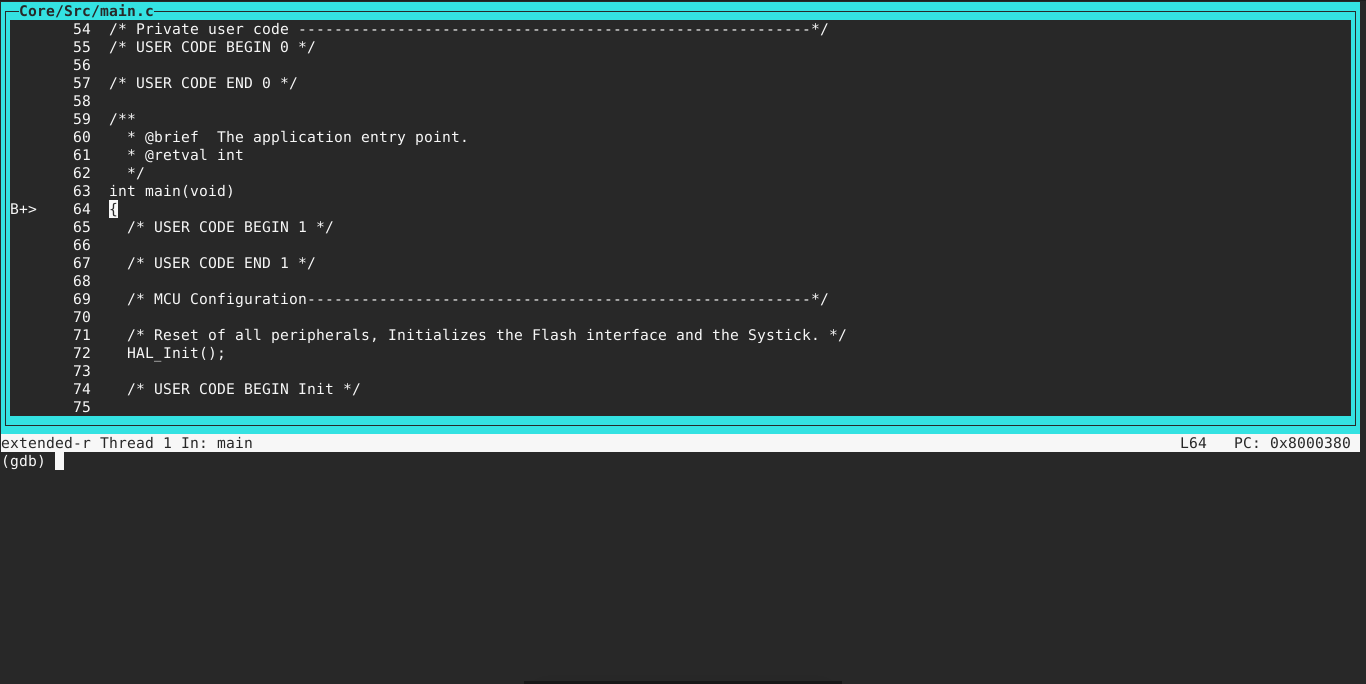
Notice the breakpoint we placed at main; breakpoints are indicated by B+. The current line of code (which will be run when you run the next command) is indicated by the > symbol. You can use the arrow keys or mouse wheel to scroll through the code and use line mumbers to set breakpoints as necessary. To switch context of arrow keys between the TUI windows use Ctrl + X followed by O.
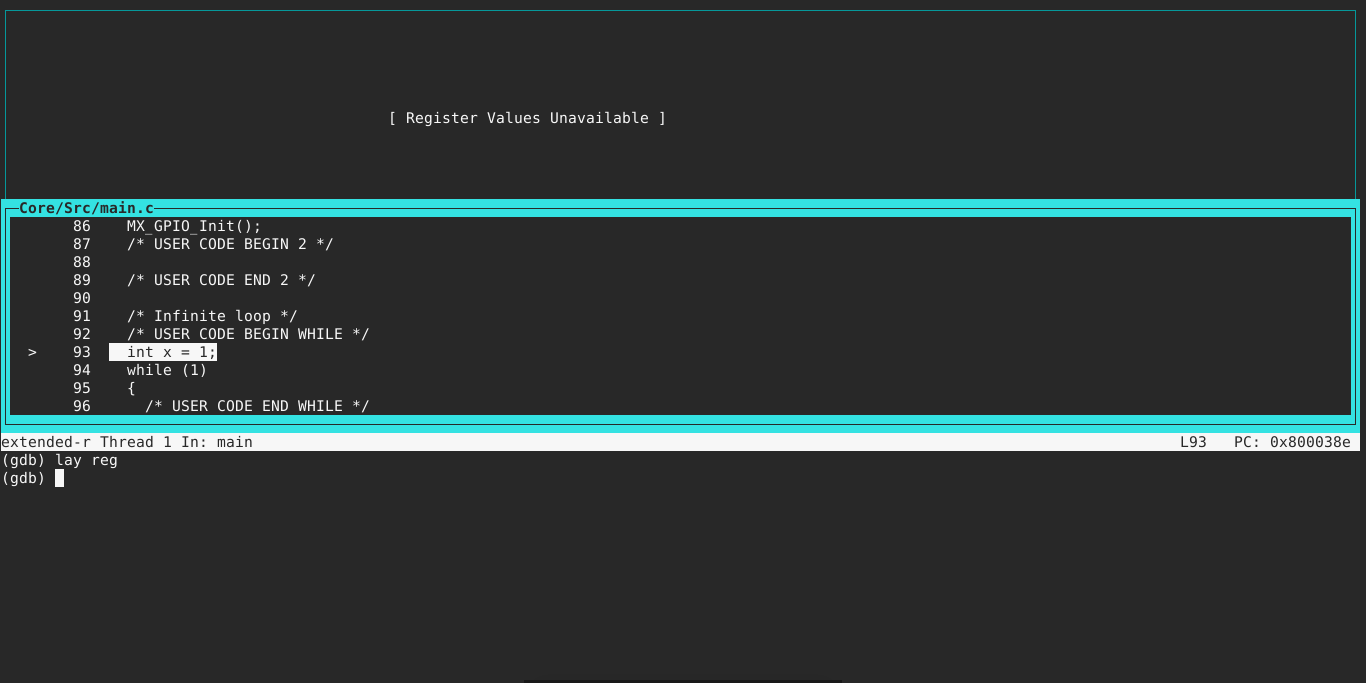
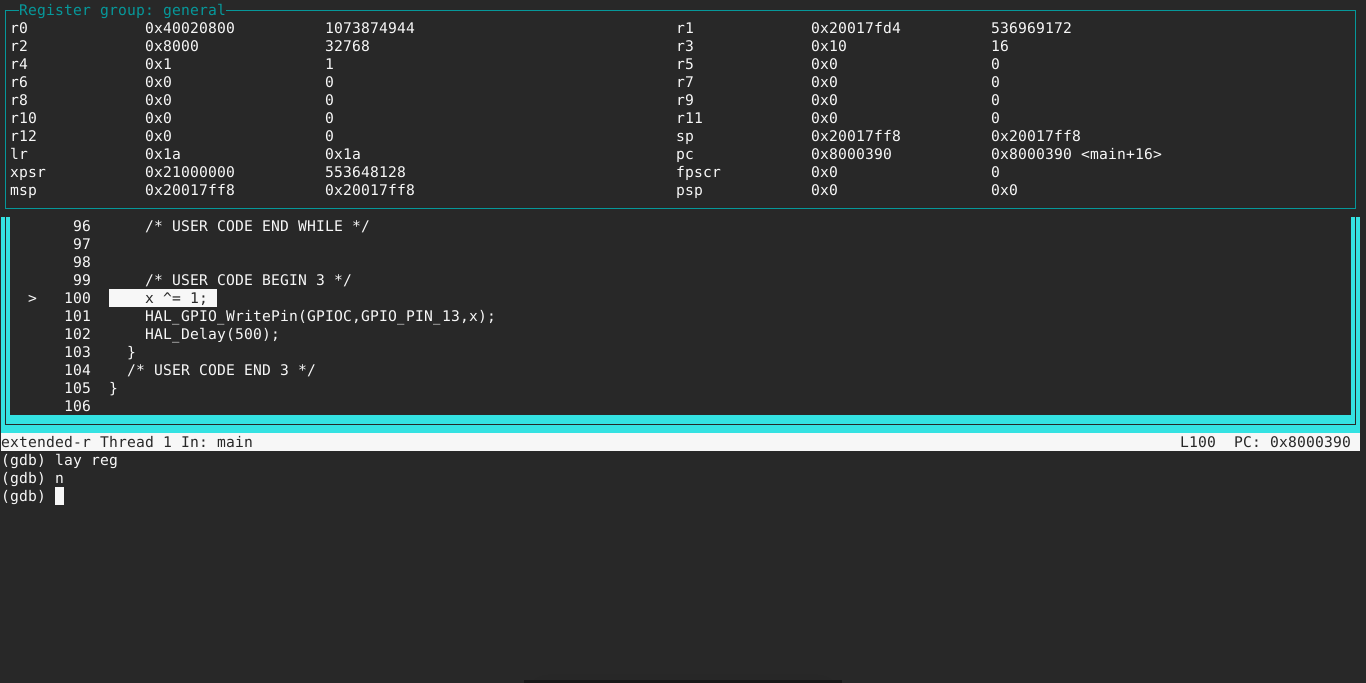
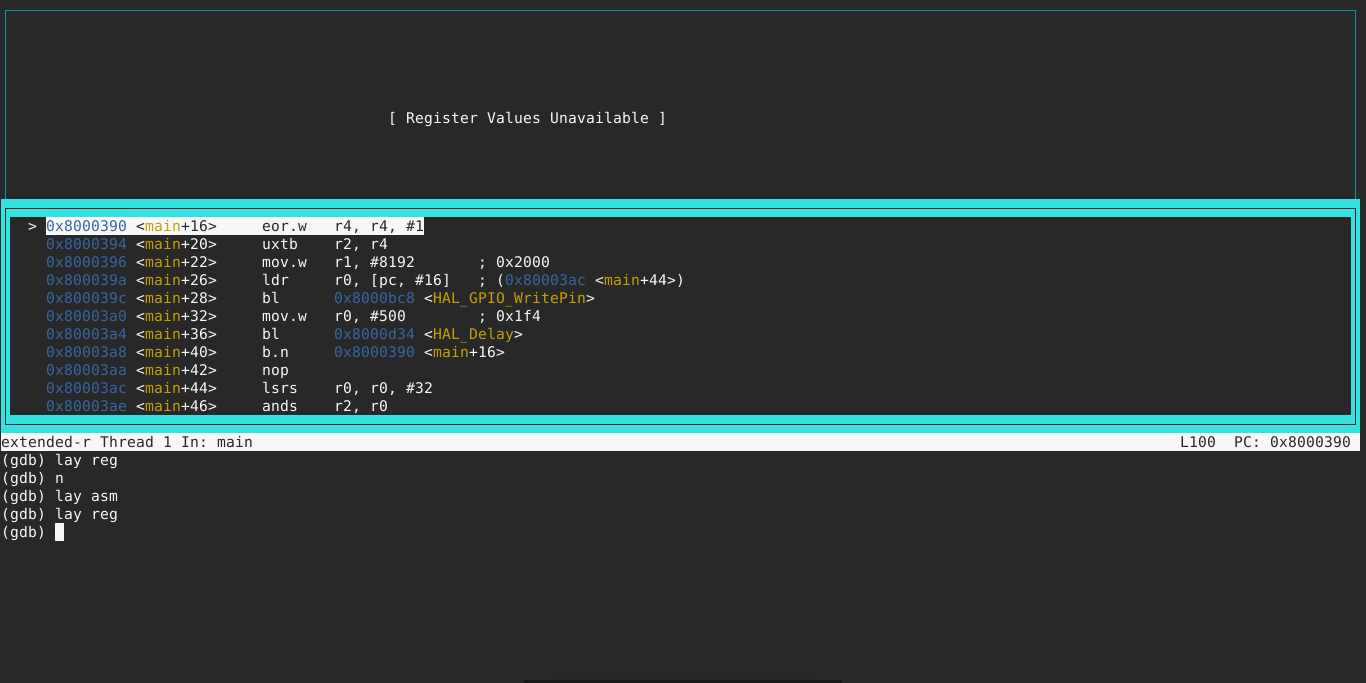
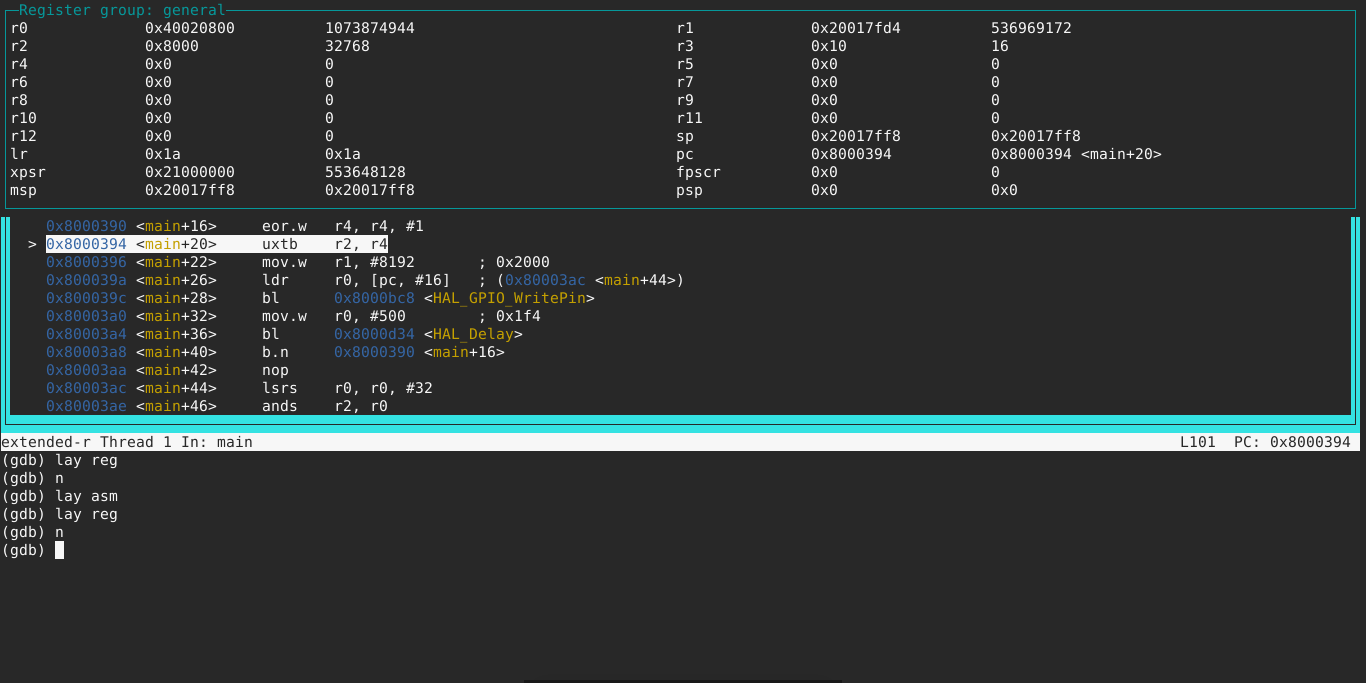
There are three important views that the TUI provides: assembly, source and registers. You can have upto two at the same time; however, the first two are mutually exclusive. Runing layout regs shows the registers view which will remain unpopulated until you run at least one line of code. Do so with next.
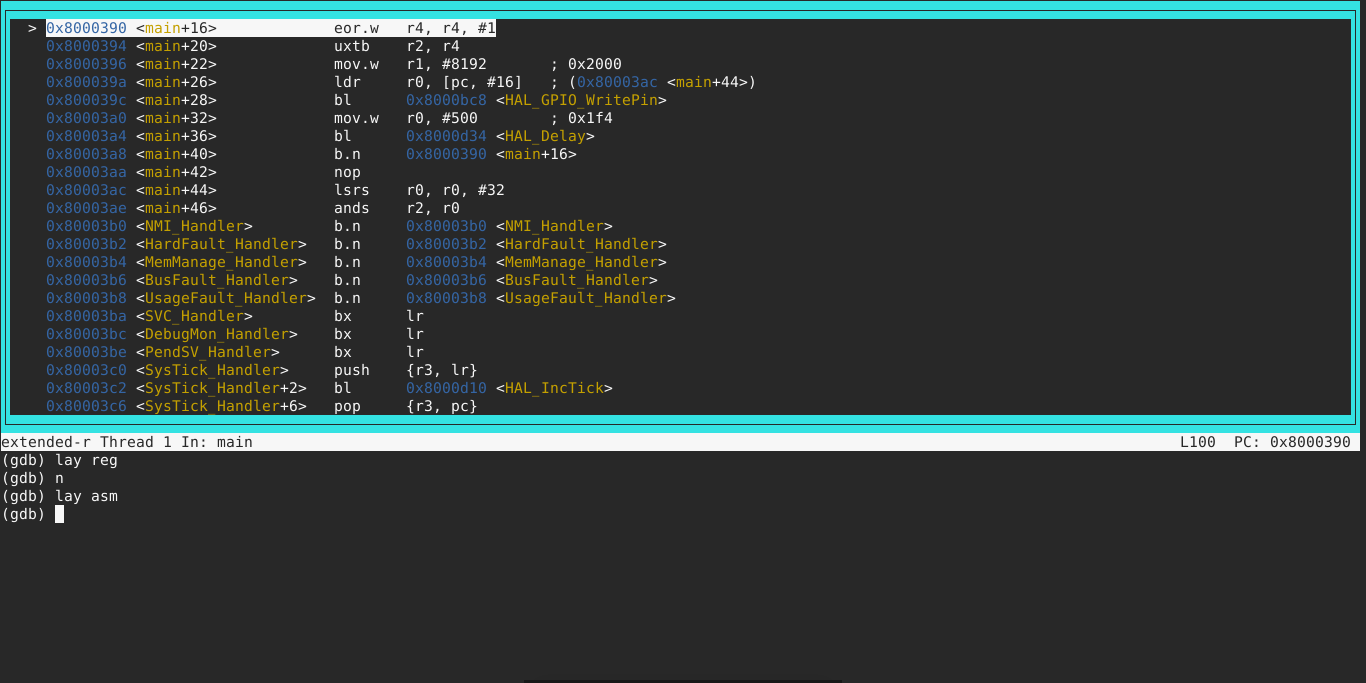
To show the assembly view, use layout asm. You can also view the registers while you are at it
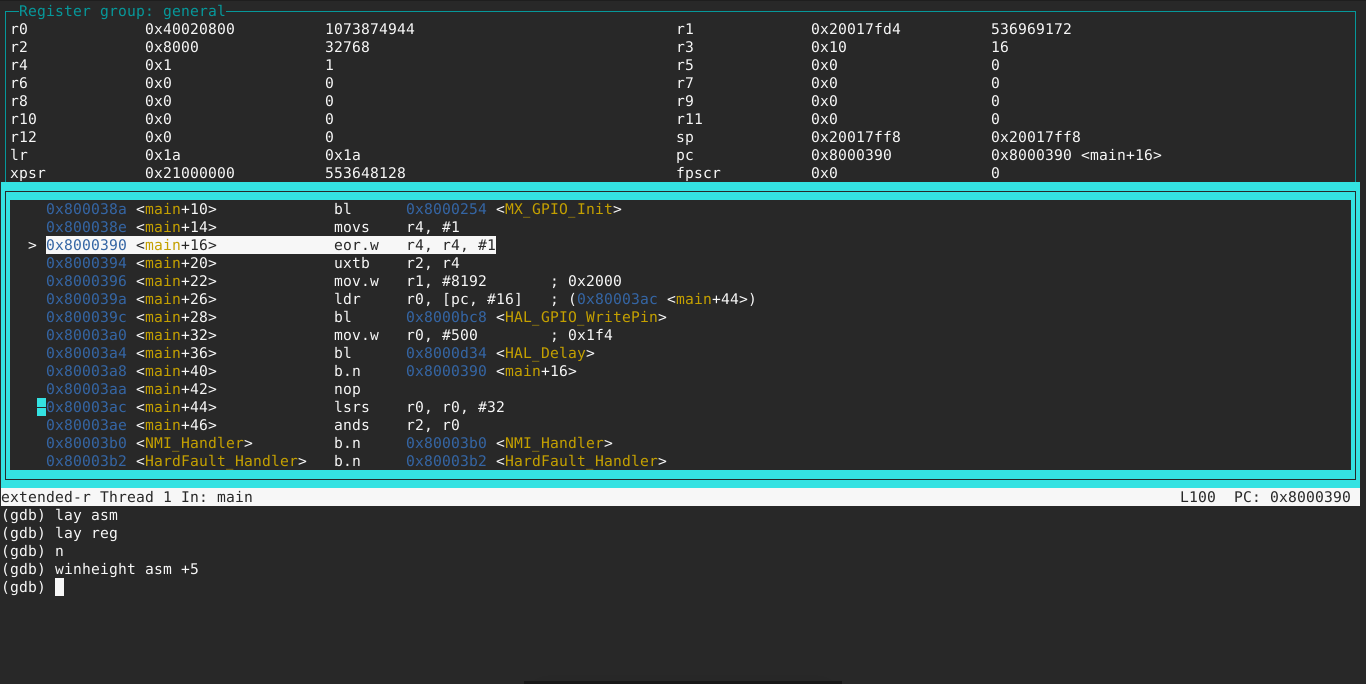
Finally, for your viewing pleasure, you might need to resize any of the displayed windows so that you can, for example, see more source code/lines of assembly at once. Do this using winheight <window> <height-change> where <window> is the name of the view you want to resize (asm/src/reg) and <height-change> is how much you want the window height to change by.
Reverse Timewalking
GDB supports code execution in reverse, but whether you can do so with your target depends entirely on whether the target supports the reverse- commands. Unfortunately, this feature is unsupported by my current hardware…so this section of the tutorial will remain a TODO for the time being.
Conclusion
A developer is only as good as their debuging utilities and techniques, and gdb paired with the FishTail probe makes bug-hunting a breeze. It might not seem like it, but we have only breached the surface as far as GDB usage is concerned. For more information on GDB usage head over to the official webpage where you will find online documentation as well as downloadable pdf for your reference
Comments